Risk Assessment Process –
Risk assessment processes have been around for a number of years. The first time I remember using one was in the early 1960s. There were a few safety regulations, but not many, and OSHA was still years away. We were looking at all the ways one could get hurt while performing welding and assembly operations to build an agricultural tool called a rolling harrow. Its use has been reduced significantly since the invention of minimum and no-till planting equipment. But back then, there was a big demand for rolling harrows and they were a difficult tool to produce—lots of heavy lifting, tricky weld positions and too many pinch points to count.
We were experiencing many injuries and we knew there was a problem. Something had to be done. So we sat down as a team, listed each step of the job, and tried to determine any exposure that could cause an injury―sharp edges, pinch points, hot material, heavy lifts, etc. This very much resembled an early version of a job hazard analysis or a job safety analysis.
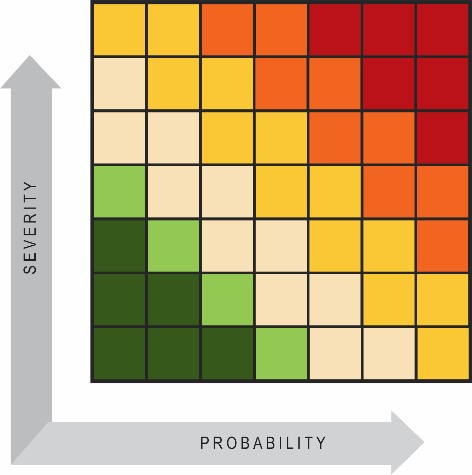
First, we considered the likelihood of an undesirable situation occurring (very likely, likely and not likely) and then we looked at the severity of the outcome and tried to assess how serious the injury might be (very serious, serious or not serious). While this isn’t rocket science, it is a system intended to create better awareness and eliminate a situation we termed “unacceptable risk”. We still use this system today and for good reason—it’s simple and it gets us to increase our awareness and correct obvious issues.
It seems easy to conclude that activities with high probability and high severity of related incidents require significant action to lower their impact, while activities with low probability and low severity of related incidents would likely not require any or very little corrective action. As reasonable as this sounds, even back then I knew something was missing in the way the risks were assessed. What about miscalculation, issues with skill deficiencies, and simple human error? The risk assessment ignores these and many other variables because its action plan is based only on two dimensions.
States of Mind and Risk Analysis
Human behavior and its results are variable. I’m an engineer. I hate variability. Give me a consistent repeatable process and it is relatively easy to improve. Give me a variable process and I now must make it repeatable and consistent before I have any chance of making improvements. So, if you look at risk and include a state-to-error analysis (e.g., how rushing can lead to a performance error), the risk might be understated if you’re using the simple two-dimensional method due to the variability introduced by human factors.
There are numerous states that can affect safety: rushing, frustration, anger, fatigue, fear, panic and overconfidence (also known as complacency). Any one of these states, or a combination thereof, can cause safety errors as well as influence quality and productivity, but they are never included in the two-dimensional method.
Complacency
While many states can affect performance, none seem to have the breadth and depth of complacency. Complacency increases risk significantly and, more worryingly, it also changes the perceived risk dramatically.
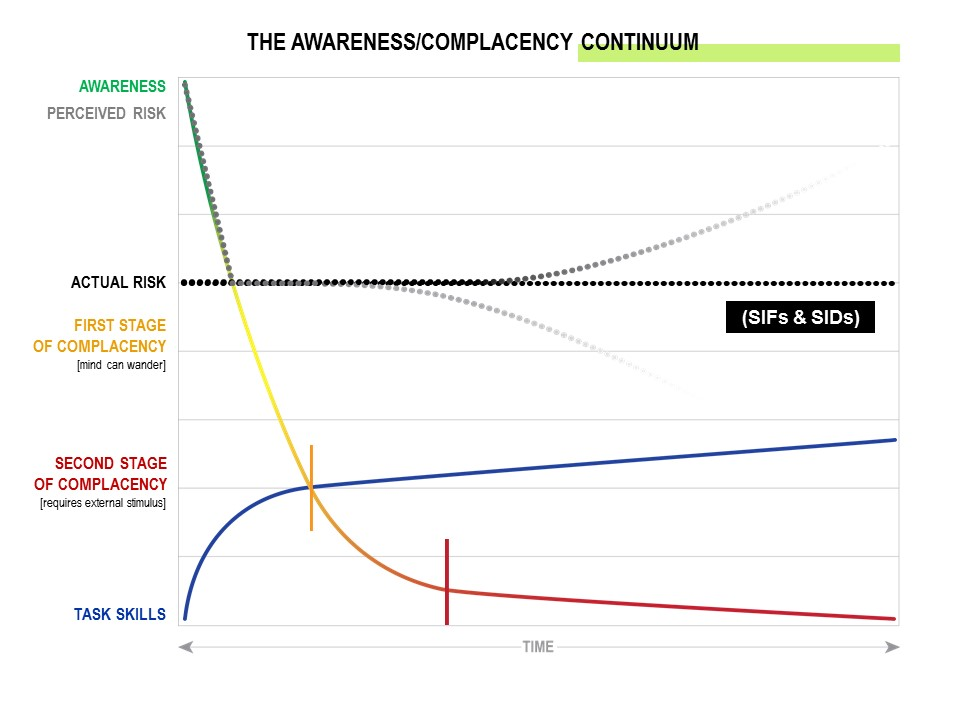
The blue line in the illustration above represents skills. It starts in the lower left corner and, as a person gains skill and knowledge, the line rises. When a person has something to learn, like riding a bicycle or a new job, they start with low skills but very high awareness. Awareness is shown by the multi-color line starting in the upper left corner (high awareness) and moving down toward the lower right corner (low awareness).
When the person becomes competent in the task they’re learning, they reach the first stage of complacency. They are now good enough at the activity that they no longer have to concentrate on it and, as a result, they can perform it while thinking about other things. At this point, there are few injuries or property damage events. The progression of complacency will likely continue as the person’s familiarity with the task increases, and it will reach the second stage of complacency where the person’s mind is more than wandering—they are at a point where something external must happen to get their mind back on the task. At this point the number of errors leading to injuries and instances of property damage will begin to increase.
Often, we calculate the actual risk of a task and apply to it a numerical evaluation. This method is very involved and its accuracy is debatable but, while I will not discuss it here, it’s a process that is very valuable and is illustrated here by the horizontal line of solid black dots.
In the eyes of the person exposed to the hazard, the perceived risk level varies. A new employee, for example, would see the risk of a job as different than what it really is. This “perceived risk” is noted by the gray dots starting in the upper left corner and moving down over time. At first, the perceived risk is higher than the actual risk. As the worker gains experience and develops skills, the perceived risk gets closer to the actual risk (this is shown where the gray dots are horizontal). At this point the worker has a realistic perception of the risk based on a comparison of actual risk and their skill level. This requires further research to verify, but what we are looking at here is a combination of research data and reasonable assumptions.
Between stage one and stage two of complacency all the calculations start to separate. Often, the actual risk is thought to be a constant, but with the addition of complacency, the risk levels change: the actual risk increases while the perceived risk continues to go down. At this point, the gap between perceived risk and actual risk is exponentially larger than most think possible. This gap is helpful in explaining some of the increase in significant injuries and fatalities that workplaces experience despite precautions and safety programs in place.
Conclusion
So what does all of this have to do with risk assessment? Well, a lot! If we consider the two-dimensional risk assessment tool mentioned at the beginning of this article, it’s clear that something very important is missing. But when we add a third dimension to account for human factors (such as complacency or rushing), the matrix changes and might look like the illustration below. This would have been handy in those early days, when I knew something was missing, because it finally closes the gaps present in two-dimensional risk assessment.
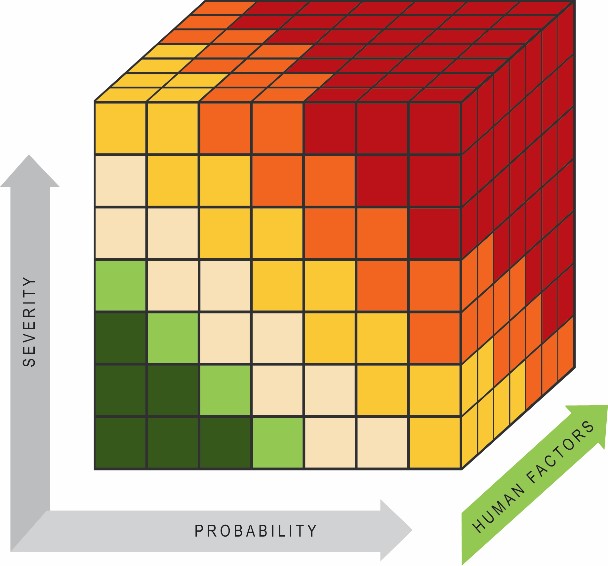
Risk probability and severity potential fluctuate based on our interaction with the hazard, and human factors can easily increase and decrease the risk. Your risk matrix needs to account for these fluctuations and using the third dimension can accomplish this. It allows us to see three aspects of safety and finally address them all.
The third dimension changes the results of the risk assessment from low risk to higher risk as complacency, frustration, fatigue or rushing enter the equation. Notice how the risk, indicated by the red and orange cubes, has increased despite the fact that the situation illustrated by the cube is exactly the same as it was in the two-dimensional assessment. We simply added human factors to the equation and, as a result, we identify more “at risk” situations than we would before. This means that we now have more aspects of safety to work on and more issues to address, but we should also see better results of our efforts.
There is a human factor―a third dimension―to all errors. This is not intended to blame the worker for the injury, poor quality of work or lower productivity. We simply need to change our management practices to limit, or remove, states that cause human errors. But it’s impossible to do so until the relevant stressors are systematically recognized. After all, managers can cause these states even when they have no intention of doing so. Simply saying, “We need to get this shipment out by 4 p.m.” can cause rushing. Unreasonable or irregular work schedules can cause fatigue. Some work processes can cause frustration as well as strained relationships with supervision and coworkers. Managers may not know the problems the employee has at home and they may not fully understand how management practices can cause performance issues, but these factors do affect the risks involved in each task.
We do not always know what state the employee is in, but we must always anticipate a certain level of risk in the third dimension. This is why safety managers often struggle with things like slips, trips and falls—they focus on physical hazards but forget about the important variable of human factors. And although approaching the third dimension isn’t an exact science, if we leave it out, the existing system remains lacking.
Gary Higbee is one of the most experienced and recognized consultants within the safety industry – earning numerous awards, he has held seats in many industry advisory boards.