Risk Assessment Process
Risk assessment processes have been around for a number of years. The first time I can remember using one was in the early 1960’s. Yes, I’m aware this is almost ancient history but it has a place in this discussion. We were looking at all the ways one could be hurt while performing welding and assembly operations while building an agricultural tool called a roller Harrow. You would have a hard time finding a roller harrow today because technological advances have made it all but obsolete. Back then we there was a big demand for the product and it was a difficult product to produce. Lots of heavy lifting, difficult weld positions and so many pinch points you couldn’t count them all. We had few safety regulations but not many and OSHA was still years away. We had many injuries and we knew we had a problem. We had to do something. So, we set down as a team and listed each step of the job and tried to determine any exposure that could cause an injury. Exposures like sharp edges, pinch points, hot material, heavy lifts etc. Much like an early version of a Job Hazard Analysis or a job safety analysis. The basic risk matrix might look like Figure #1 below.
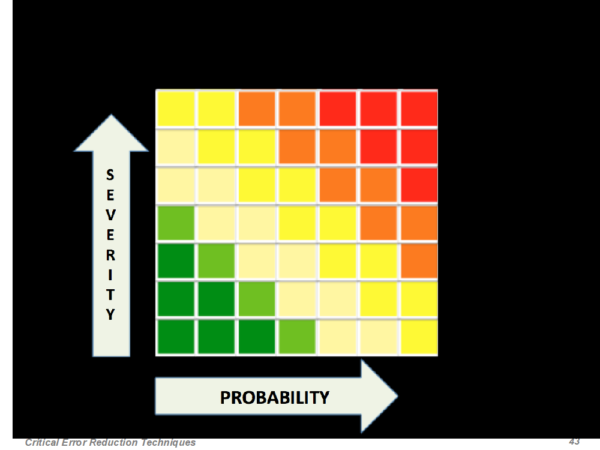
Figure 1
I’ve taken the liberty to have five levels of risk represented signified by the colors red, orange, yellow, beige, lime green and green. Most of the risk assessments I’ve seen have only three colors and of course 3 risk levels.
Essentially, we looked at the likelihood of something happening (Very Likely, Likely and not Likely). Then we looked at the severity possibility if that something happened. We wanted to know how serious the injury might be. (Very Serious, Serious or Not Serious). While this isn’t rocket science it is, a system intended to create better awareness, and eliminate a situation we termed unacceptable risk. We use this system even today and for good reason. This system is simple and it gets us to increase our awareness and correct obvious issues.
The logical conclusion is that high probability and high severity required significant action to lower both severity and probability. While low probability and low severity would likely not require any or very little corrective action. Well this all sounds good but there is an effectiveness issue because it is based only on two dimensions – likelihood and severity. Even back then I knew something was missing in the way the risks were assessed. What about miss calculation, errors in judgement, issues with skill deficiencies or even simple human error. The risk assessment ignores any of these variables or others for that matter.
Discussion Example
As a long time baseball player and later a coach we tried to limit errors on defensive. Skill development, Process Positioning, Functional Dexterity, Muscle Memory, you name it we worked on it. We kept all types of data on errors and why they might have happened. The simple fact was the likelihood of an error was determined more by the speed of the runner than it was by anything else. Fast runners had the effect of making the fielder rush to the ball and even rush their throw. The rushing of the throw often caused the throw to be off line and the runner would be safe. Sometimes the throw would be so far off line that the runner was not just safe at first but they might reach second if the ball went into the dugout or the stands. There were even cases when the ball didn’t go in the dugout but rolled into the outfield or into foul territory. And then the runner would reach third or maybe even home. The result level of the error was variable. So, when the fielder was stressed the likelihood of an error increased as well as the seriousness of the result.
Another Issue to Consider
Now there is another issue with this situation and it involves the variability of the result. Just because the fielder rushes the throw doesn’t mean the result is always a negative result. What if the rushed throw turns out to be a great throw. Now the fielder gets on ESPN because he made the greatest defensive play of the week. Now we have added the issue of a positive result from a negative act. In other words, “Positive Reinforcement for a Negative Act”. This can only encourage the rushing of a throw in the future and that rushed throw has all the result variables discussed previously.
Variability and Process Improvement
I’m an engineer I hate variability give me a consistent repeatable process and it is relatively easy to improve. Give me a variable process and I now must make repeatable and consistent before I have any chance to improve it. So, if you look at risk and include this state to error analysis the risk might be understated using the simple two-dimensional method.
There are a number of states that can stress the situation, states like Rushing, Frustration, Anger, Fatigue, Fear, Panic and Over Confidence often called complacency. Any one or a combination can cause errors and not just safety errors but also quality and productivity errors.
Conclusion
So, what does all this talk about errors and states have to do with the topic of risk assessment. Well a lot! Returning to the risk assessment tools mentioned above, we are missing something very important if we stick with just two dimensions.
There is a human factor to all errors, a third dimension if you will. Now this is not intended to blame the player for the error or the worker for the injury, poor quality or lower productivity. What we need to do is change our management practices to limit or remove stress that causes the errors. We can’t make that change until we can systematically recognize them. Using a three-dimensional risk assessment tool will do that for us. With three dimensions process you can see the stress as well as the probability and severity. You see, we can cause these stresses even when we have no intention to do so. Just saying we need to get this shipment out by 4PM can cause rushing for example. In addition, the employee brings all kinds of issues with them to work each day that can alter their focus also. We may not know those issues the employee has or we may not understand fully how our management practice can cause performance issues but they do affect the risk of performing a task.
Risk probability and severity potential fluctuates based on our interaction with the risk.
The risk matrix needs to account for these fluctuations – a third dimension.
Given we do not always know what state our employee or player is in means we must anticipate a certain level – a calculated guess if you will. I know it isn’t an exact science but if we leave it out the existing system isn’t an exact science either. Think of the third dimension as an exponential curve moving from less risk to more risk over time as complacency, frustration, fatigue or rushing increases. The result is more at risk situations identified than we originally thought. Now we have more to work on but we should also see better results.
Gary Higbee is one of the most experienced and recognized consultants within the safety industry – earning numerous awards, he has held seats in many industry advisory boards.